There are two ways to turn a spreadsheet into an app. The first keeps the sheet as the database and puts an application on top of it: Glide, AppSheet and Softr do this in an afternoon, and every edit in the app lands in a cell. The second moves the data into a real database and generates the application on it: it takes a day or two, and in exchange you get roles, a history of changes, and no row limit. The rule of thumb is simple. Keep the sheet if one team uses it, mostly to read, and it holds a few thousand rows. Move the data if several people write to it every day, if some of them must not see everything, or if the file has quietly become the company's system of record.
This guide covers both paths: the limits that make the switch necessary, how to prepare the file, which is most of the work whichever path you take, a five-step method, and the tools compared on price, row ceilings and what you own at the end. It applies to Excel and Google Sheets alike, and to the CSV export of almost anything else.
Two ways to turn a spreadsheet into an app
The phrase "spreadsheet to app" hides two very different operations. In the first, nothing moves: a tool connects to your Google Sheet or Excel file, reads the rows, and shows them as lists, forms and detail pages on a phone or in a browser. In the second, the rows are imported once into a database, the sheet is archived, and the application owns the data from then on.
| Path | How it works | First version | The spreadsheet becomes | Best for |
|---|---|---|---|---|
| An app on top of the sheet (Glide, AppSheet, Softr) | The tool reads and writes the sheet's rows; each column becomes a field | Hours | The database, still | Forms, lists and lookups for a small team; field data entry |
| A database and a generated app (Cadrant, or low-code on PostgreSQL) | Rows are imported into tables with relations; screens and roles are generated | A day or two | An archive | Multi-user tools with roles, rules and history |
When a spreadsheet stops being enough
The technical limits are generous and rarely the real problem. An Excel worksheet holds 1,048,576 rows by 16,384 columns, and a Google Sheets file holds up to 20 million cells. The limits you hit first are human ones.
| Limit | Spreadsheet | Application on a database |
|---|---|---|
| Size | Excel: 1,048,576 rows per sheet. Google Sheets: 20 million cells. Old XLS: 65,536 rows | Millions of rows per table without a product cap |
| Several people writing | Last save wins, or a conflict copy appears | Each row is saved on its own; no overwrites |
| Who sees what | Hidden tabs and protected ranges, easy to bypass | Roles enforced in the database, row by row |
| Who changed what | Version history of the file, not of the record | A log per record, with author and time |
| Rules | Formulas and data validation, deletable by any editor | Validations and constraints that nobody can skip |
The quieter problem is error. Ray Panko's compilation of field audits at the University of Hawaii found that 88% of the 113 operational spreadsheets audited since 1995 contained errors, most of them in formulas nobody had checked. If your file shows two or more of the five signals in our guide on how to build internal tools, several editors, hidden rows, a tab nobody dares to touch, no history, re-typed data, the second path is the one to plan for.
Prepare the file: from columns to tables
Whichever tool you pick, it will read your file the same way: one header row, one record per line, one value per cell. Most spreadsheets that grew over years break all three rules somewhere. An hour of cleaning before the import saves a day of fixing afterwards.
Then comes the step that turns a sheet into a data model. Look for values that repeat: a customer name typed on forty order rows, a product and its price copied on every line. Each repeated thing becomes its own table, with an ID, and the original row keeps only the ID. This is called normalisation, and it is the difference between a file and a database.
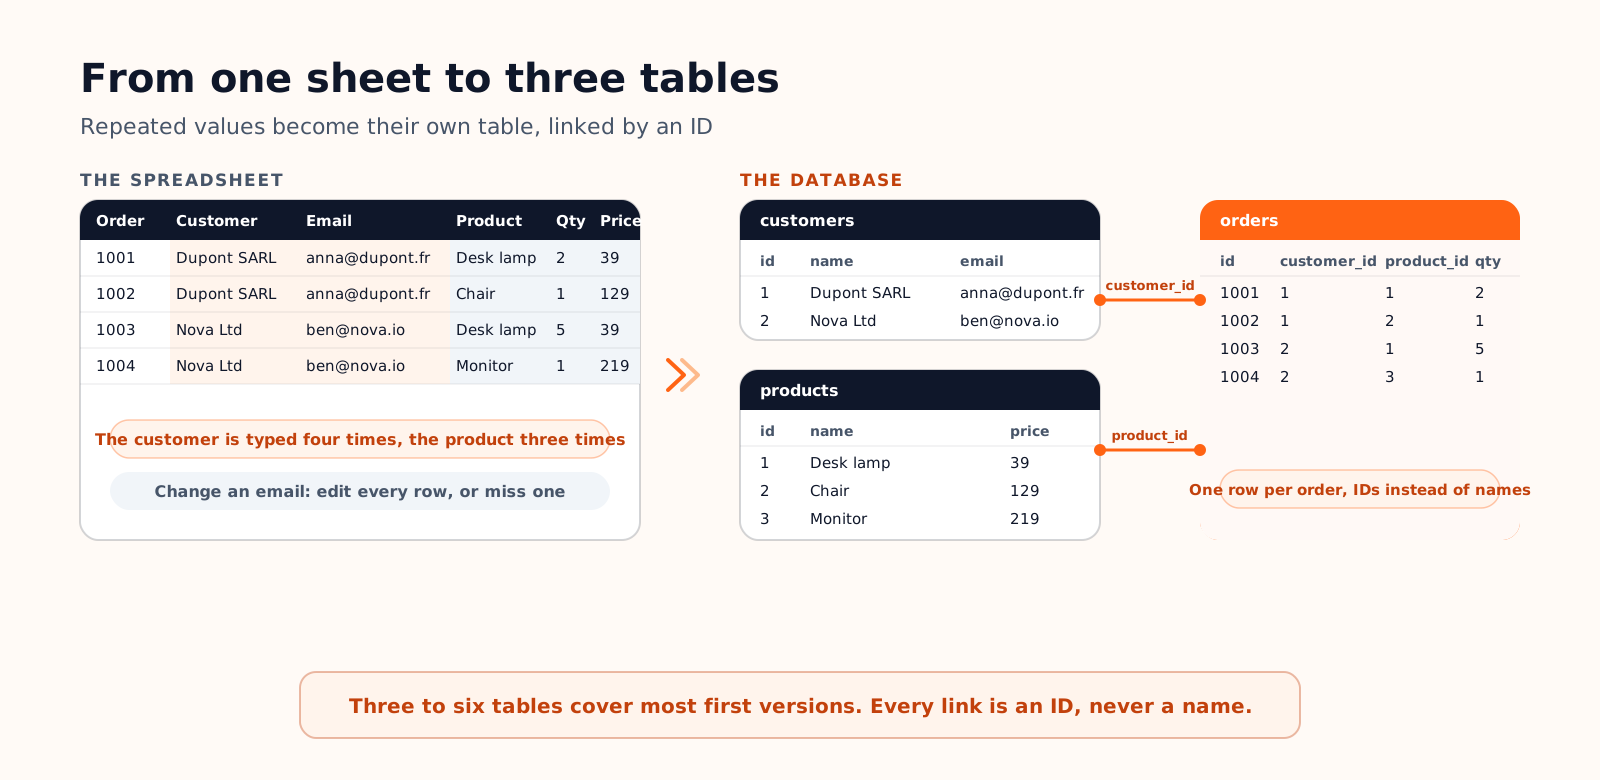
Formulas deserve a decision each. A column that computes a total from quantity and price becomes a computed field. A column that flags late orders becomes a rule in the application. A pivot tab that summarises sales by month becomes a dashboard screen, generated from the orders table. None of them is imported as data.
Build the app in five steps

- 1. Freeze the file and export it. Announce a date, set the sheet to read-only, and export one CSV per tab. On the first path, this is where you connect the tool to the sheet instead.
- 2. Create the tables and import the rows. Import the reference tables first (customers, products), then the tables that point to them (orders). Check the row counts against the sheet before going further.
- 3. Generate the screens. A list, a detail page, a form and a status change for each main table. Nothing more in the first version: no reporting, no notifications.
- 4. Rebuild the rules. Data validation becomes required fields and allowed values. Formulas become computed fields. The colour code becomes statuses. Write the role matrix: who can see, create, edit and delete in each table.
- 5. Run both for one week. Three real users, real data, the spreadsheet frozen alongside. Collect every complaint in one list, fix the data model once, then retire the file.
On Cadrant, steps 2 to 4 are what the platform generates from that brief. It creates a React application connected to a PostgreSQL database in your own Supabase project, with tables, relations and indexes derived from the description, and login pages on Supabase Auth with the roles you named. Rows are imported from CSV in the Supabase dashboard, which you can open from the project's Database panel, and the row-level security policies that enforce who sees what are created in the database from the prompt; the documentation recommends reviewing them before production. The Starter plan is $20 a month however many colleagues use the tool, and the code syncs to a GitHub repository. Details are on the internal tool builder page.
Which tool for which spreadsheet
Prices are public list prices in September 2026, billed annually where a choice exists. We list Cadrant first because it is our own product and the only one below that takes the second path; the three others are the reference tools for the first path, and for a small read-mostly team they are the faster answer.
| Tool | Approach | Pricing | Row ceiling | What you own | Best for |
|---|---|---|---|---|---|
| Cadrant | Import into PostgreSQL, generate the app from a description | Flat, from $20 a month, no seats | None from the product | Database on your Supabase, code on GitHub | Multi-user tools with roles and rules |
| Glide | App on top of Sheets, Excel or its own tables | $19 to $199 a month; business users beyond 30 at $5 each; updates metered | 25,000 rows per app on a spreadsheet | The sheet; the app stays on Glide | Polished mobile apps for a small team |
| AppSheet | App on top of Sheets, Excel or a database | $5 to $20 per user a month; Core included in most paid Google Workspace plans | The source's, with sync limits | The sheet; the app stays on AppSheet | Field data entry in a Google Workspace company |
| Softr | Portals on Airtable, Sheets or SQL | $25, $119 or $395 a month with user quotas | The source's | The source; the app stays on Softr | Client portals on data you keep elsewhere |
If your data already lives in Airtable rather than a sheet, the same reasoning applies with one more variable, the seat bill; our guide to Airtable alternatives covers that case.
- Two paths: an app on top of the sheet in hours, or the data moved to a database and the app generated in a day or two.
- Spreadsheets fail on people before they fail on size: concurrent edits, no roles, no history, rules anyone can delete.
- Preparation is most of the work: one header row, one value per cell, an ID per row, repeated values split into their own tables.
- Import references first, generate the smallest screens, rebuild the rules, run both for a week.